
Ramadan 2026 Shariah-Compliant Stock Picks
With the holy month of Ramadan starting, now is a suitable time to position in high-conviction, Shariah-compliant US equities exhibiting a combination of strong analyst consensus and high upside potential.
The Ramadan Effect
Historically, Ramadan has been a positive sentiment window for Ethical and Islamic investments. The collective psychological impact of the holy month provides support for Sharia Compliant investments.
This year, the sentiment tailwinds are additionally buoyed by structural tailwinds for Islamic finance, as Islamic Finance assets globally grew by 14.9% YoY in 2025, reaching an impressive $5.2 Trillion, and total outstanding sukuk listed at Nasdaq Dubai crossed $100 billion. With less speculative and more disciplined positioning, along with increased focus on more value-based investing, Ramadan is an overall positive catalyst for Islamic and Faith-based investing.
Islamic Idea Ratings Snapshot
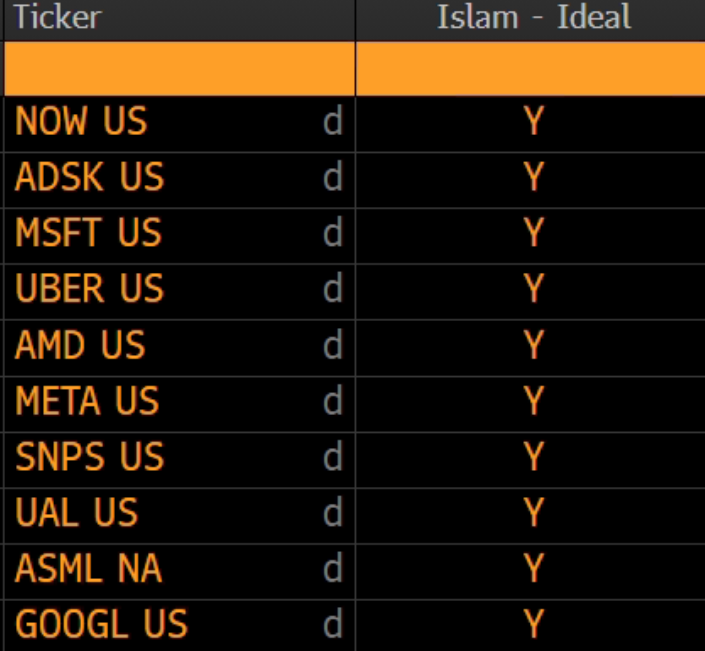
Source: Bloomberg
Top 10 Sharia-Compliant Stock Picks
| Name | Ticker | Sector | 52 Week Low ($) | *Last Price ($) | 52 Week High ($) | Market Capitalization ($ Billions) | Analyst Target Price ($) |
|---|---|---|---|---|---|---|---|
| ServiceNow Inc | NOW | Software | $98.00 | $106.48 | $211.48 | $111.38 | $187.88 |
| Autodesk Inc | ADSK | Software | $232.67 | $243.58 | $329.09 | $51.64 | $366.4 |
| Microsoft Corp | MSFT | Software | $344.79 | $413.27 | $555.45 | $3068.79 | $601.11 |
| Uber Technologies Inc | UBER | Ground Transportation | $60.63 | $73.5 | $101.99 | $152.72 | $104.98 |
| Advanced Micro Devices Inc | AMD | Semiconductors | $76.48 | $213.57 | $267.08 | $348.21 | $291.83 |
| Meta Platforms Inc | META | Interactive Media & Services | $479.80 | $670.72 | $796.25 | $1697.16 | $861.43 |
| Synopsys Inc | SNPS | Software | $365.74 | $437.45 | $651.73 | $83.69 | $559.8 |
| United Airlines Holdings Inc | UAL | Passenger Airlines | $52.00 | $116.36 | $119.21 | $38.13 | $138.66 |
| ASML Holding NV | ASML | Semiconductors | $578.51 | $1413.62 | $1493.48 | $548.69 | $1669.29 |
| Alphabet Incs | GOOGL | Interactive Media & Services | $140.53 | $318.58 | $349 | $3854.16 | $375.7 |
| Name | Potential Price Appreciation | Total Analyst Recommendations | Recommendation Consensus | Beta | Islamic Rating | ||
|---|---|---|---|---|---|---|---|
| Buy | Hold | Sell | |||||
| ServiceNow Inc | 76% | 45 | 4 | 1 | 4.74 | 1.43 | Y |
| Autodesk Inc | 50% | 29 | 3 | 0 | 4.81 | 1.06 | Y |
| Microsoft Corp | 45% | 68 | 3 | 0 | 4.92 | 1.03 | Y |
| Uber Technologies Inc | 43% | 53 | 10 | 1 | 4.59 | 1.32 | Y |
| Advanced Micro Devices Inc | 37% | 54 | 13 | 1 | 4.53 | 1.86 | Y |
| Meta Platforms Inc | 28% | 76 | 6 | 1 | 4.77 | 1.29 | Y |
| Synopsys Inc | 28% | 23 | 3 | 1 | 4.63 | 1.61 | Y |
| United Airlines Holdings Inc | 19% | 24 | 3 | 0 | 4.74 | 1.20 | Y |
| ASML Holding NV | 18% | 20 | 2 | 1 | 4.57 | 1.53 | Y |
| Alphabet Incs | 18% | 70 | 9 | 0 | 4.72 | 1.05 | Y |
Source: Bloomberg
*Last price as of 10th February 2026
ServiceNow is currently dominating a $275B enterprise workflow automation market, and on track to exceed $1 billion in AI-driven annual contract value by 2026 with its Now Assist platform. Subscription revenue is growing at over 21% y/y, government business grew 30%+ over the past two quarters, and deeper integrations with Microsoft 365 Copilot and GitHub are expanding the serviceable addressable market while entrenching its role as the mission-critical AI orchestration layer for enterprises.
.png)
Autodesk is the leading incumbent platform in architecture, engineering, and construction software, and is in the midst of a several-years-long transition to subscription-based cloud revenue that has made it more margin-accretive and predictable. The consensus is that its cloud migration and AI-powered design toolkits will ensure several more years of predictable double-digit growth.
Azure is Microsoft's primary driver of growth, with AI workloads expected to drive sustained 30%+ growth and lift long-term cloud market share. The company’s commercial remaining performance obligations (RPO) reached $368B, up 35% YoY, providing strong multi-year revenue visibility. Microsoft will likely emerge as the largest cloud-infrastructure provider by 2029, driven primarily by accelerating inference workloads from OpenAI.
Uber dominates the global ride-hailing and delivery market with network effects that are nearly impossible to replicate. Profitability has inflected meaningfully, and the company is expanding into autonomous vehicle partnerships and logistics adjacency that extend its total addressable market well beyond ride-sharing.
.png)
AMD's MI350 GPUs are gaining share in AI inference workloads, and the next-generation MI450 GPU has already secured a major long-term supply deal with OpenAI, a 6GW multi-year deployment agreement with initial delivery in H2 2026. Analysts project strong annualized FCF growth through the end of the decade, positioning AMD as NVIDIA's primary challenger in the AI accelerator market.
.png)
Trading at approximately 21x forward earnings, at the low end of its historical range, Meta is the most efficient deployer of AI in digital advertising, with machine learning models boosting ad targeting and conversion rates. The Manus AI acquisition ($2 billion, December 2025) strengthens its consumer-facing AI agent capabilities, and with $625 billion in collective hyperscaler capex plans for 2026, Meta's infrastructure investments are translating directly into margin expansion.
.png)
Synopsys is a dominant franchise in the mission-critical EDA industry, increasingly so with the Ansys acquisition that expands the TAM by nearly 60%. FY2026 is a key to prove out Ansys revenue synergies and margin recovery. The stock offers attractive long-term compounding potential given the company's monopolistic market position, AI innovation, and highly recurring revenue base.
.png)
United has provided guidance for 2026, forecasting adjusted Earnings Per Share (EPS) of $13.48. This projection is supported by strong growth in premium cabin revenue (+9% in Q4), a thriving loyalty program adding 9% to the full-year revenue, and the introduction of four new transatlantic destinations and six new international routes for Summer 2026.
The airline's annual investment of over $1 billion in customer experience enhancements such as Polaris suites and Starlink Wi-Fi which could help set it apart from Ultra-Low-Cost Carrier (ULCC) rivals.
.png)
ASML stands as the exclusive producer of extreme ultraviolet (EUV) lithography machines, granting it a monopoly over the most crucial bottleneck in semiconductor manufacturing. In its latest quarter, ASML achieved record bookings of €13.2 billion, and its guidance for 2026 revenue (€37.5billion) surpasses market consensus. The stock has gained over 21% year-to-date, fueled by technology giants' generative Artificial Intelligence (AI) capital expenditures, which have created record demand for advanced semiconductor manufacturing capacity.
Alphabet Inc. is a global technology leader dominating digital advertising and AI. Its core business relies on a massive ecosystem (Search, Android, YouTube, Cloud) with seven products exceeding 2 billion users. Deep integration of Gemini AI across all platforms reinforces its market dominance and forms a powerful competitive moat. Google Cloud’s 79% YoY backlog surge to $155B and mid-30% growth outlook reflect strong enterprise adoption, supported by proprietary TPU cost advantages and long-term AI workload contracts. Alphabet’s expanded capex plan and seventh-gen TPU performance gains underpin cost leadership, enabling margin resilience and accelerating growth.
Stocks Highlights
Average analyst consensus: 4.70/5, overwhelmingly bullish across all 10 names.
Average upside: nearly 40%, significant upside to target prices from current levels.
AI and cloud tailwinds: 7 of 10 stocks are direct beneficiaries of the AI infrastructure boom.
Disclaimer:Century Financial Consultancy LLC (CFC) is licensed and regulated by the Capital Market Authority (CMA) of the UAE under license numbers 20200000028 and 301044 to carry out the activities of Financial Products dealer, Trading Broker in international markets, Trading Broker of OTC derivatives and currencies in the spot market, Introduction, Financial Consultations, and Promotion. CFC is incorporated under UAE law, registered with the Dubai Economic Department (No. 768189), with its office at 601, Level 6, Building No. 4, Emaar Square, Downtown Dubai, UAE, PO Box 65777.
Terms and Conditions of Access
By accessing and continuing to use the Publication (which includes this document, flyer, charts, diagrams, illustrations, images, calculations, scenario analysis, and related data or content), you confirm that you have read, understood, and agreed to the terms of this Disclaimer.
CFC reserves the right to amend or update the Publication and this Disclaimer at any time without prior notice. Continued use following any such update constitutes your acceptance of the revised terms. If you do not agree with these terms, please discontinue use of the Publication.
Purpose and Intended Use
This Publication is classified as marketing material and should not be regarded as independent investment research. It is provided for informational, educational, and illustrative purposes only and does not constitute investment advice, a recommendation, an offer, or a solicitation to buy or sell any financial instruments or services. All views expressed are general market commentary and may not reflect the opinions of CFC as a whole.
Risk Disclosures and Limitations
The information presented does not cover all the risks associated with the products or scenarios discussed. Please refer to the full Risk Disclosure Statement available on our website.
This Publication reflects information available at the time of preparation and does not account for subsequent developments. Any forward-looking statements involve assumptions and uncertainties; actual outcomes may differ materially. CFC does not guarantee the accuracy, completeness, or reliability of the information and disclaims liability for any action taken based on it.
No Offer or Contractual Commitment
No part of this Publication constitutes an offer, agreement, or commitment to enter into any transaction. Distribution of this Publication does not oblige CFC to engage in any trade or provide any services. Product names or terms may differ across platforms or providers. This material should not be interpreted as legal, regulatory, tax, accounting, or credit advice. Recipients should seek independent professional advice and assess their own financial situation, objectives, and risk profile before making investment decisions.
Data Sources and Interpretation
This Publication may rely on publicly available data, third-party information, or model-based assumptions. CFC makes no representation or warranty as to their accuracy or completeness. Data limitations, errors, or outdated inputs may impact the reliability of projections or scenarios. Names of financial products may differ from those used on trading platforms.
Use, Reproduction, and Analyst Disclosure
This Publication is intended solely for the recipient’s informational use. It may not be copied, transmitted, or distributed in any form, wholly or partially, without prior written permission from CFC.
Analyst Declaration: The Analyst(s) certifies that all opinions expressed in this Publication represent their own independent views and that reasonable care was taken to ensure objectivity. They do not hold securities in the companies mentioned, and their compensation is not linked to the views expressed. CFC’s research and marketing divisions operate independently.
Trading Risk Warning:
Trading in financial products involves significant risk. Leveraged OTC derivatives, such as Contracts for Difference (CFDs) and spot forex contracts, carry a high risk of loss that can potentially exceed initial deposits and may not be suitable for all investors. These instruments do not confer ownership of underlying assets. Investors must carefully evaluate their investment objectives and risk tolerance, and consult independent advisors where appropriate.


Regulated by CMA
Century Financial Consultancy LLC


.png)
.png)
.png)
.png)
.png)

Reach us:
-
Dubai
6th Floor, Emaar Square Building 4,
Downtown, Dubai, P.O. Box 65777,
Dubai, United Arab Emirates -
Abu Dhabi
27th Floor, Office 2701,
Shining Towers, Abu Dhabi, UAE -
Sharjah
29th Floor, Office 2905,
The Business Tower, Sharjah, UAE - +971 (4) 356 2800
- info@century.ae

Disclaimer: Trading in financial products carries substantial risk. Leveraged over-the-counter (OTC) derivatives, such as Contracts for Difference (CFDs) and spot forex, may result in losses exceeding initial deposits and may not be suitable for all investors. These complex instruments do not confer ownership of the underlying assets. Investors should carefully consider their investment objectives and risk appetite, and seek independent professional advice if necessary.
Century Financial Consultancy LLC (CFC) is licensed and regulated by the Capital Market Authority (CMA) of the UAE under license numbers 20200000028 and 301044 to carry out the activities of Financial Products dealer, Trading Broker in international markets, Trading Broker of OTC derivatives and currencies in the spot market, Introduction, Financial Consultations, and Promotion. CFC is incorporated under UAE law, registered with the Dubai Economic Department (No. 768189), with its office at 601, Level 6, Building No. 4, Emaar Square, Downtown Dubai, UAE, PO Box 65777.
The content on this website is provided solely for informational and educational purposes and does not constitute an offer, recommendation, or solicitation to buy or sell any securities or financial products.
Products and services offered by CFC are not intended for use in any jurisdiction where such use or distribution would breach local laws or regulatory requirements.
⚠️ Alert: Fraudulent Activity Notice
Century Financial Consultancy LLC (“Century”) has become aware of fraudulent individuals and entities impersonating our firm through unofficial websites, social media channels, and messaging applications such as Telegram, WhatsApp, and Discord.
Please be advised:
- Century does not manage investments on behalf of clients.
- Century does not solicit funds or guarantee investment returns.
- Century does not accept or make payments in cash, cryptocurrency, or digital assets.
- We do not conduct business via social media or messaging platforms.
Our only official website is www.century.ae, and all communication is conducted exclusively through verified channels.
We strongly urge the public to remain vigilant, verify the authenticity of any communication claiming to be from Century, and report any suspicious activity. Century disclaims any responsibility for losses arising from dealings with unauthorised or fraudulent parties.
