Understanding support and resistance levels is one of the most essential skills in technical analysis. Let’s break it down.
Support and resistance are like the building blocks of technical analysis. Prices in the market are constantly moving due to the forces of supply and demand, and these levels show where those forces balance out.
What is Support?
Think of support as a safety net on a price chart. It’s a level or zone below the current market price where there’s enough buying interest to stop a price drop and possibly push prices back up. In other words, it’s where buyers step in and say, "We’re not letting the price fall any further."
When looking at a trendline, the low points, or troughs, represent support levels. Recognizing these levels is a key skill in technical analysis, as they can indicate where the price might bounce back up.
What is Resistance?
Resistance is the flip side of support. It’s a level or zone above the current market price where selling pressure might overpower buying pressure, causing the price to reverse direction and move downward. It’s like a ceiling that the price struggles to break through.
It’s important to remember that just because the price has hit a previous high doesn’t mean it will stop there again with pinpoint accuracy. However, you can generally expect some resistance around that area.
The uptrend and downtrend in support and resistance is shown in figure 2.1 and figure 2.2 respectively.

Practical Tips for Identifying Support and Resistance
Identifying support and resistance levels means figuring out which key prices are shaping the trend or range and why they stand out compared to other prices. There are some helpful tips and guidelines to determine how legitimate and strong a price level is, whether it’s support or resistance:
- Times Tested: If a price level has been "tested" (meaning the market has hit or come close to it) several times, it often sticks in the minds of traders. For instance, traders might hesitate to sell when the price nears a previous low if past experience suggests it’s a bad idea.
- Volume at the Level: Building on the first point, when a significant amount of trading volume has occurred at or near a certain level, it tends to catch the attention of market participants.
- Recent Activity: The more recent the trading activity at a specific level, the more relevant that level becomes in analysing current market prices.
- Round Numbers: There’s a psychological aspect to trading where round numbers (like 50, 100, 1000) tend to stand out. Traders often remember these numbers, which can influence their decisions.
This can be seen in figure 2.3


Trading Strategies Using Support and Resistance
Support and resistance levels are powerful tools for deciding when to enter or exit trades, especially when combined with smart risk management. Here are some practical ways to use them:
- Taking Profits: This is the price where you decide to lock in gains on a trade. For example, if the price is nearing a support level from above, short sellers might choose to take their profits. On the flip side, when the price approaches a resistance level from below, long traders may decide to cash out.
- Entering a New Position Near an Unbroken Level: When the price is approaching a support level, a trader focused on technical analysis might place limit buy orders just above that support. Similarly, they might place limit sell orders near and slightly below resistance levels.
- Entering a New Position After a Level Breaks: If a support level breaks, it can be a signal to open a short position, expecting the price to drop to the next lower support level. Conversely, if a resistance level is breached, it could be an opportunity to buy, anticipating the price to rise to the next higher resistance level—if one exists.
- Setting a Stop-Loss: You can also use the break of a support or resistance level to limit your losses. Instead of seeing a breach as a chance to open a new position, it can be a cue to exit a losing trade immediately. The breach of a support or resistance level serves as a clear signal to cut your losses.
Once broken, support and resistance levels reverse roles. This is a key aspect of support and resistance identification: once a level (whether support or resistance) is broken, the technical characteristic of the level is reversed. That is, a broken support now becomes a resistance and a broken resistance now becomes a support. This can be seen in figure 2.4.


Technical analysis in ranges
One of the most useful technical patterns is a sideways trend, or range. It allows a simple, mechanical strategy to be followed as detailed below.


Getting Started with Support and Resistance Trading
The first step in trading with support and resistance is to identify the levels that are currently influencing the market’s price movements. Once you’ve pinpointed these key areas, the idea is to strategically place your buy orders just above the support level and your sell orders slightly below the resistance level. It’s also a good practice to set stop-loss orders to protect yourself in case the market moves against your trade.
An example:
A basic example of a trade plan, with a planned limited risk (for instance the difference between our orders and the exit), for a hoped-for return. There are two possible scenarios that may follow on from this plan:
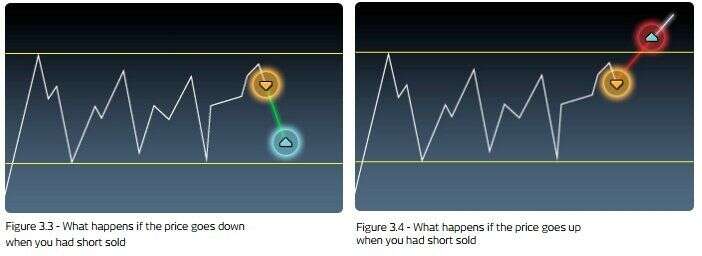
If the trade plan outlined in figure 3.2 is used and a sell position is entered into, one of two events will occur. They are outlined in figures 3.3 and 3.4. Figure 3.3 shows the ideal scenario. A short (sell) position was entered into at the top of the range, near the high and resistance level, with a stop loss on the other side of resistance.
From the selling point, the price falls back to the lower end of the range and the take profit order (near support) is triggered and the position is exited with a profit.
Figure 3.4 shows the scenario to avoid, but that you must be prepared for. A short (sell) position was entered at the top of the range, near the high and resistance level, with a stop loss on the other side of resistance. From the selling point, the price rises back to, and through, the upper end of the range, instead of falling. In doing so, it hits and triggers the stop loss. This position is therefore exited with a loss. Note: please be aware that this is a very basic outline of a possible trading plan. You should never stop learning and practicing in this area.


- This is a theoretical example of a trade plan, driven by identification of support and resistance
- The application of buy and sell orders based on point 1
- The application of stop loss measures to limit risk and safeguard performance. Below, the schematic method shown in figures 3.3 and 3.4 has been applied to a practical (but historic) trading plan and market
Planning Your Trade: A Practical Example
Let’s walk through a practical scenario. Imagine that a support level has been broken, causing the price to drop significantly. After some time, the price starts to recover and approaches the old support level, which has now turned into a resistance level.


At this point, you have two strategies to consider:
- Short Selling: You could place a short sell order just below the resistance level, with a stop-loss set just above it. This approach anticipates that the price will drop again.
- Waiting for a Breakout: Alternatively, you might wait to see if the price breaks through the resistance. If it does, you could place a buy order just above the breakout, with a stop-loss slightly below the old resistance, which should now act as a new support level.


Key Patterns to Watch For:
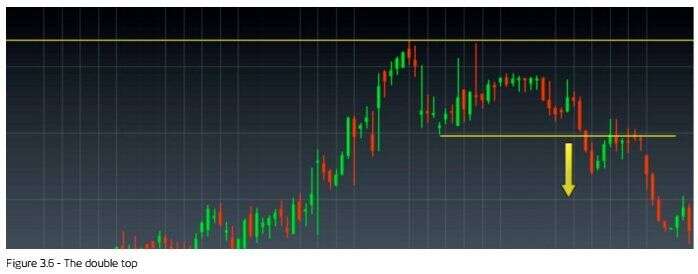
One pattern to be aware of is the Double Top (as shown in figure 3.6). This occurs when the price tests a resistance level twice, then falls back down to the support level and eventually breaks through it. The specific name of the pattern isn’t as important as recognizing that a significant level, such as support, has been breached.
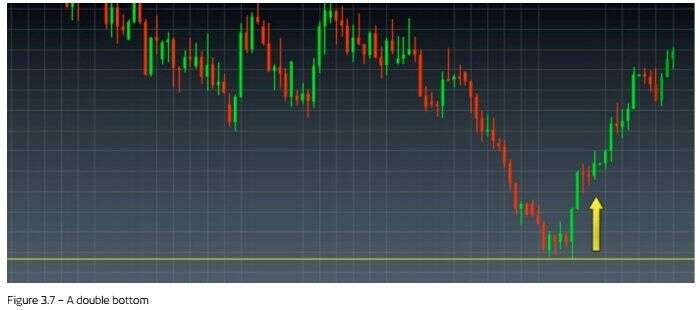
If there are three distinct tests of the resistance level followed by a drop that breaks through the support, this pattern is called a Triple Top.
A pattern is only confirmed once the support or resistance levels are broken. Until then, it remains a potential pattern that might or might not play out.


Century Financial Consultancy LLC (CFC) is duly licensed and regulated by the Securities and Commodities Authority of UAE (SCA) under license numbers 2020000028 and 2020000081, to practice the activities of Trading broker in the international markets, Trading broker of the Over-The-Counter (OTC) derivatives and currencies in the spot market, Introduction, Financial Consultation and Financial Analysis, and Promotion. CFC is a Limited Liability Company incorporated under the laws of the UAE and registered with the Department of Economic Development of Dubai (registration number 768189).
CFC may provide research reports, analysis, opinions, forecasts, or information (collectively referred to as Information) through CFC’s Websites, or third-party websites, or in any of its newsletters, marketing materials, social media, individual and company e-mails, print and digital media, WhatsApp, SMS or other messaging services, letters, and presentations, individual conversations, lectures (including seminars/webinars) or in any other form of verbal or written communication (collectively referred to as Publications).
Any Information provided in this publication is provided only for marketing, educational and/or informational purposes. Under no circumstances is any Information meant to be construed as an offer, recommendation, advice, or solicitation to buy or sell trading positions, securities, or other financial products. CFC makes no representation or warranty as to the accuracy or completeness of any report or statistical data made in or in connection with this Publication and accepts no responsibility whatsoever for any loss or damage caused by any act or omission taken as a result of the use of the Information.
Please refer to the full risk disclosure mentioned on our website.
Ready to Invest?
Explore a new trading experience with
Century Trader App
Losses can exceed your deposits
Ready to Invest?
Explore a new trading experience with
Century Trader App
Losses can exceed your deposits


